Summary
Monte Carlo methods refer to a technique for approximating a solution to a problem that may be difficult or simply impossible to resolve via a closed-form/analytical solution. The key concept in Monte Carlo is to simulate the problem repeatedly with random samples. As the number of simulations grows, the results drive towards the actual solution.
In this post, I demonstrate two very simple simulations that in fact have known solutions: Pi and e. The third simulation is something I contrived with some effort (not much) at model accuracy: Estimate how long it takes to get attacked by fire ants in a typical backyard.
Calculation of Pi via Monte Carlo
This can be considered the canonical example of Monte Carlo as it has been well-documented. The essence of how it works depends the ratios of area between a square and circle inscribed inside of the square. You generate a random distribution of points within the square and the ratio of points inside the circle vs total points follows the area ratio.
Picture below depicts the problem set up.
 |
Mathematical basis below.
Implementation in Python
def simulation(numPoints):
    in_circle = 0
    total = 0

    for _ in range(numPoints):
        x = random.uniform(0,2)
        y = random.uniform(0,2)

        d = (x-1)**2 + (y-1)**2
        if d <= 1.0:
            in_circle = in_circle + 1
        total = total + 1

    ans = 4 * in_circle/total
    return ans

if __name__ == '__main__':
    random.seed()


    results = {}
    for numPoints in [10,100,1000,10000,100000,1000000]:
        ans = simulation(numPoints)
        results[numPoints] = ans

    frame = pd.DataFrame(data=list(results.items()), columns=['NumPoints', 'Result'])
    frame['PctError'] = ((frame['Result'] - math.pi) / math.pi).abs() * 100
    del frame['Result']
    frame.sort_values(by='NumPoints', inplace=True)
    frame.reset_index(inplace=True, drop=True)
    print(frame)
    frame.plot(x='NumPoints', y='PctError', kind='bar', title='Monte Carlo Pi Calculation', color=['b'])
    plt.show()
Results
   NumPoints   PctError
0         10  10.873232
1        100   3.132403
2       1000   0.967896
3      10000   0.763710
4     100000   0.225597
5    1000000   0.044670

Calculation of e via Monte Carlo
Stochastic representation of the mathematical constant e below. You can go directly to code from this.
Implementation in Python
def simulation(numIters):
nsum = 0
for _ in range(numIters):
xsum = 0
n = 0
while xsum < 1:
x = random.uniform(0,1)
xsum = xsum + x
n = n + 1
nsum = nsum + n
return nsum/numIters
if __name__ == '__main__':
random.seed()
results = {}
for numIters in [10,100,1000,10000,100000,1000000]:
ans = simulation(numIters)
results[numIters] = ans
frame = pd.DataFrame(data=list(results.items()), columns=['Iterations', 'Result'])
frame['PctError'] = ((frame['Result'] - math.e) / math.e).abs() * 100
del frame['Result']
frame.sort_values(by='Iterations', inplace=True)
frame.reset_index(inplace=True, drop=True)
print(frame)
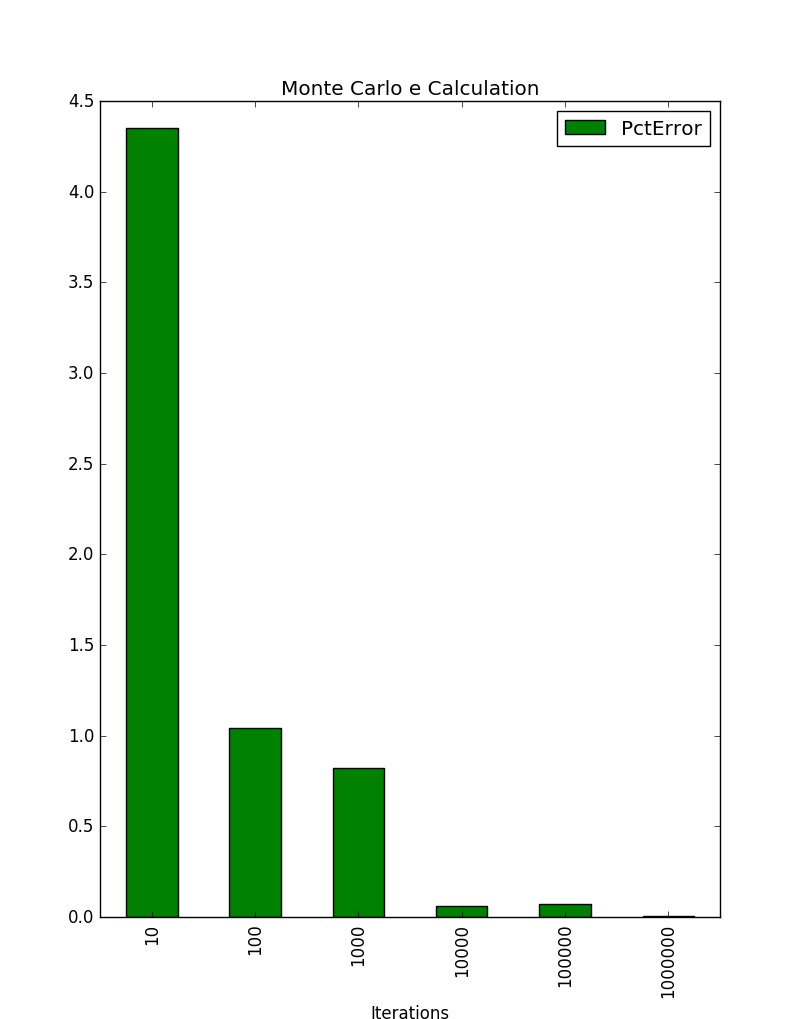
frame.plot(x='Iterations', y='PctError', kind='bar', title='Monte Carlo e Calculation', color=['g'])
plt.show()
Results
   Iterations  PctError
0          10  4.351345
1         100  1.040430
2        1000  0.819703
3       10000  0.058192
4      100000  0.072773
5     1000000  0.005512
Fire Ant Simulation
This last simulation is admittedly contrived and likely less than scientifically accurate. The focus is on the Monte Carlo method. However, I can say I have some first-hand experience with this model via ~20 years spent in Texas for under-grad work and various military assignments. For those unfamiliar with fire ants - they are a uniquely offensive member of the animal kingdom. They bite + sting and are extremely aggressive when disturbed. Fire ants are in never-ending abundance in Texas. On that note - I used some fire ant data from this Texas A&M website.
This simulation is a model of a typical residential backyard and the fire ant population therein. The question to be answered: How long can I sit in my backyard until at least one fire ant is tearing me up?
Diagram of the model below:
 |
| Rude awakening imminent |
Model Assumptions
- 100' x 30' = 3000 sq ft 'yard'
- 5 ant mounds in the yard
- 500K ants
- Ant mounds are randomly distributed in yard
- Ants are randomly distributed amongst the mounds.
- All ants start the simulation at their home mound position.
- Ants have 2 states in the model. Foraging or attacking.
- 1 human exists in the model. The human is randomly positioned in the yard with the assumption they will not sit directly on a mound. This assumption is a partial deviation from reality to ensure statistically interesting experiments. I've personally sat on a fire ant mound (inadvertently). I don't recall it being statistically interesting.
- Ants move 3 inches/second, or 1 foot in 4 seconds.
- Time steps in the model are 4 seconds
- Ants on the move ('foraging') will randomly choose among 8 possible directions at each time step. This provides the randomness of the model.
- Ants on the move will stay the course in 1 direction for an entire time step (same direction for 1 foot/4 seconds)
- Ants can't leave the boundaries of the yard. An attempt to do so results in no movement for that time step.
- Only 50% of the ant population makes a move in any given time step. The rest are idle for that time step.
- Once an ant gets within 1 foot of the human position, it starts attacking. An attacking ant never leaves the 'attacking' state. Again, I can attest from personal experience that this represents reality.
- The simulation ends when at least 1 ant achieves the 'attacking' state.
Python Implementation
class Yard(object):
    length = 100 #3000 sq ft yard
    width = 30
    numMounds = 5
    numAnts = numMounds * 100000 #100K ants per mound
    pctAntsActive = .5 #percentage of the ants moving at any given time step

    def __init__(self):
        random.seed()
        self.__setMounds()
        self.__setAnts()
        self.__setHuman()

    def __setMounds(self):
        self.moundPositions = []
        xlist = random.sample(range(0, Yard.length+1), Yard.numMounds)
        ylist = random.sample(range(0, Yard.width+1), Yard.numMounds)
        for i in range(Yard.numMounds):
            mound = (xlist[i], ylist[i])
            self.moundPositions.append(mound)

    def __setAnts(self):
        self.ants = []
        for _ in range(Yard.numAnts):
            mound = random.choice(self.moundPositions)
            self.ants.append(Ant(mound))

    def __setHuman(self):
        done = False
        while not done:
            x = random.randint(0, Yard.length)
            y = random.randint(0, Yard.width)
            if (x, y) not in self.moundPositions:
                done = True
            else:
                pass

        self.humanPosition = (x, y)

    def clockTick(self):
        antsAttacking = 0
        activeAnts = random.sample(range(0, Yard.numAnts), int(Yard.numAnts*Yard.pctAntsActive))

        for ant in activeAnts:
            state = self.ants[ant].move(self.humanPosition)
            if state == 'attacking':
                antsAttacking += 1
                break
            else:
                pass

        return antsAttacking
Line 1: Class definition of the "Yard"Lines 2-6: Class variables capturing some the model assumptions
Lines 8-12: Class initializer which sets up the model.
Lines 14-20: Function to randomly distribute the ant mounds in the yard.
Lines 22-26: Function to create the ant objects and randomly distribute them among the mounds.
Lines 28-38: Function to randomly position the human in the yard, but not on top of a mound.
Lines 40-52: Main driver of the simulation. Provides a four-second time step during which a random 50% distribution of ants make a one-foot move. Function returns the number of ants that reached the 'attacking' state in that time step.
class Ant(object):
    __directions = ['NW', 'N', 'NE', 'E', 'SE', 'S', 'SW', 'W']

    def __init__(self, position):
        self.position = position
        self.state = 'foraging'

    def __checkAttack(self, humanPosition):
        distance = math.sqrt((self.position[0] - humanPosition[0])**2 + (self.position[1] - humanPosition[1])**2)
        if distance <= 1:
            return 'attacking'
        else:
            return 'foraging'

    def move(self, humanPosition):
        if self.state == 'foraging':
            direction = random.choice(Ant.__directions)

            if direction == 'NW':
                x = self.position[0] - 1
                y = self.position[1] + 1
            elif direction == 'N':
                x = self.position[0]
                y = self.position[1] + 1
            elif direction == 'NE':
                x = self.position[0] + 1
                y = self.position[1] + 1
            elif direction == 'E':
                x = self.position[0] + 1
                y = self.position[1]
            elif direction == 'SE':
                x = self.position[0] + 1
                y = self.position[1] - 1
            elif direction == 'S':
                x = self.position[0]
                y = self.position[1] - 1
            elif direction == 'SW':
                x = self.position[0] - 1
                y = self.position[1] - 1
            elif direction == 'W':
                x = self.position[0] - 1
                y = self.position[1]
            else:
                pass

            if x >= 0 and x <= Yard.length and y >= 0 and y <= Yard.width:
                self.position = (x, y)
            else:
                pass
            self.state = self.__checkAttack(humanPosition)
        else:
            pass

        return self.state
Line 1: Ant class definitionLine 2: Class variable containing a list of the 8 different directions an ant can move
Lines 4-6: Class initializer setting an ant's initial position and state.
Lines 8-13: Private class function for determining if an ant is within 1 foot of the human's position. If so, the ant's state is set to 'attacking.'
Lines 15-54: Resets an ant position by 1 foot in a randomly chosen direction. If the resulting position is outside of the yard boundaries, the ant remains stationary. Returns the new state of the ant based on its new position.
def simulation():
    yard = Yard()
    seconds = 0
    numAttacking = 0

    while numAttacking == 0:
        numAttacking = yard.clockTick()
        seconds += 4

    return seconds
Lines 1-10: Global function providing simulation driver. Sets up the 'yard' and runs a clock until at least 1 ant is attacking the human.if __name__ == '__main__':
simIters = [25,50,75,100]
avg = {}
for iters in simIters:
tot = 0
pool = mp.Pool()
results = []
for _ in range(iters):
results.append(pool.apply_async(simulation))
pool.close()
pool.join()
for res in results:
tot += res.get()
avg[iters] = round(tot / iters)
print(iters, avg[iters])
frame = pd.DataFrame(data=list(avg.items()), columns=['Iterations', 'Seconds'])
frame.sort_values(by='Iterations', inplace=True)
frame.reset_index(inplace=True, drop=True)
print(frame)
frame.plot(x='Iterations', y='Seconds', kind='bar', title='Monte Carlo Fire Ant Attack Simulation', color=['r'])
plt.show()
Lines 2-16: Sets up a loop that proceeds through 4 different iteration runs of the simulation (25,50,75,100) and creates a multiprocessing pool to run them. Run time of each simulation is stored for its particular iteration count and then averaged.Lines 19-24: Sets up a pandas data frame with the results and display a bar graph.
Results
25 198
50 189
75 121
100 166
   Iterations  Seconds
0          25      198
1          50      189
2          75      121
3         100      166

Source: https://github.com/joeywhelan/montecarlo
Copyright ©1993-2024 Joey E Whelan, All rights reserved.